Running to Victory! An Analysis of BYU's Run-Pass Balance
We've always heard that teams need a balanced offense, a steady dose of rushing and passing the football. We wanted to find what the perfect ratio of running and passing has been for BYU, so we researched it! Read about our findings here.

From 2004 through 2017, BYU Football played a total of 179 games. They had a cumulative record of 117-62, a win percentage of 65.4%. We set out to see what commonalities their wins had or rather what drives them to win. The answer to this question is even more complicated than you'd think. In statistics, there is a saying, "correlation does not imply causation." One example of this may be that if a team reaches 100 rushing yards every time they win, it doesn't necessarily mean that reaching 100 rushing yards causes them to win. Cause and effect is difficult to parse out, however we can find the importance of some aspects of the game. We looked into multiple aspects of the game, but today we're just going to talk about one of them.
The stat that we're going to discuss is the ratio of rushing attempts to passing attempts. We have always heard that some kind of balance is always important to football. So, we wondered, is there a sweet spot? Is there a perfect ratio for how often a team should run vs how often they should pass? We looked into it and found some interesting results for BYU.
Of the 179 games of the 14 seasons that we looked at, BYU has rushed more than or equal to the amount of times they passed in 96 games, and they passed more than they rushed in 83 games.
85% compared to 42%??? This data is across multiple head coaches, multiple offensive coordinators, and multiple schemes. We even found that this ratio is more tightly correlated to wins than it is to how many points BYU scores! Now we thought this is getting interesting, so we decided to break it down even further.
Please fill out the short survey below, we look at every response.

From 2004 through 2017, BYU Football played a total of 179 games. They had a cumulative record of 117-62, a win percentage of 65.4%. We set out to see what commonalities their wins had or rather what drives them to win. The answer to this question is even more complicated than you'd think. In statistics, there is a saying, "correlation does not imply causation." One example of this may be that if a team reaches 100 rushing yards every time they win, it doesn't necessarily mean that reaching 100 rushing yards causes them to win. Cause and effect is difficult to parse out, however we can find the importance of some aspects of the game. We looked into multiple aspects of the game, but today we're just going to talk about one of them.
The stat that we're going to discuss is the ratio of rushing attempts to passing attempts. We have always heard that some kind of balance is always important to football. So, we wondered, is there a sweet spot? Is there a perfect ratio for how often a team should run vs how often they should pass? We looked into it and found some interesting results for BYU.
Of the 179 games of the 14 seasons that we looked at, BYU has rushed more than or equal to the amount of times they passed in 96 games, and they passed more than they rushed in 83 games.
Wins
|
Losses
|
Win Percentage
|
Number of Games
|
Specialty
|
82
|
14
|
85.42%
|
96
|
Rushing ≥ Passing
|
35
|
48
|
42.17%
|
83
|
Passing > Rushing
|
0
|
0
|
N/A
|
0
|
Rushing < 10%
|
0
|
0
|
N/A
|
0
|
10% <= Rushing < 20%
|
0
|
5
|
0.00%
|
5
|
20% <= Rushing < 30%
|
4
|
22
|
15.38%
|
26
|
30% <= Rushing < 40%
|
31
|
21
|
59.62%
|
52
|
40% <= Rushing < 50%
|
39
|
11
|
78.00%
|
50
|
50% <= Rushing < 60%
|
34
|
3
|
91.89%
|
37
|
60% <= Rushing < 70%
|
9
|
0
|
100.00%
|
9
|
70% <= Rushing < 80%
|
0
|
0
|
N/A
|
0
|
80% <= Rushing < 90%
|
0
|
0
|
N/A
|
0
|
90% <= Rushing <= 100%
|
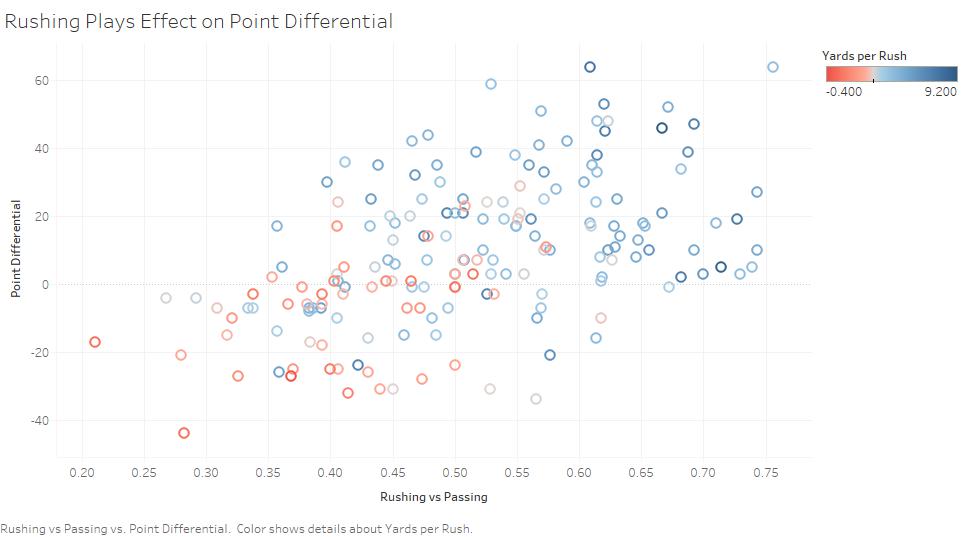
The data shows that as BYU rushes more, they win more games. If you're more visual, here's a graph that breaks it down.
So, the more BYU rushes in a game, the more likely they are to win, right? The answer? Yes and no. The more BYU has rushed in a game, the more they have won, but simply rushing more in a game does not necessarily cause BYU to win. For instance, rushing more only digs the team into a deeper hole if their run game is not effective and efficient. Instead, this shows just how vitally important a run game has been to BYU's success. In other words, it seems to be that when BYU has an effective run game and utilizes it, they are successful.
As a note, we considered that the data may be skewed by the fact that when teams are winning, they tend to "run out the clock." They do so by running the ball and keeping it in bounds, to keep the clock running and avoid the other team possessing the ball. We checked this by looking only at the games that ended within a score of a touchdown or less. We found that the correlation (between rushing vs passing ratio and wins) is slightly less, but still exists. Only using games that are within a touchdown also takes away the possibility that your run game helped to dominate the opponent, so we fully expect that the correlation is significant.
Of last year's 4-9 season, BYU rushed more than they passed 6 times, those games resulted in a record of 4-2. We know that last year was riddled with injuries and the passing game was subpar, but so was the run game. If BYU had a more effective run game last year, would they have won significantly more games? We cannot know for certain, but we would assert that they would have. We also wonder which is MORE important to a run game, the running back or the offensive line?
We looked into a few other teams' end of year stats, which obviously are different than looking at their individual game statistics. We pooled the statistics for the top 14 teams according to the final AP Rankings and the 14 teams that won 2 games or less and found the following averages.
Top 14
|
Bottom 14
|
Stat
|
Top 14
|
Bottom 14
|
Stat
|
7772
|
6508
|
Rushing Attempts
|
40485
|
25292
|
Rushing Yards
|
5771
|
4843
|
Passing Attempts
|
7772
|
6508
|
Rushing Attempts
|
57.39%
|
57.33%
|
Rushing %
|
5.21
|
3.89
|
Yards per Rushing Attempt
|
*Top 14: Alabama, Georgia, Oklahoma, Clemson, Ohio State, Central Florida, Wisconsin, Penn State, TCU, Auburn, Notre Dame, USC, Miami, Oklahoma State
*Bottom 14: UTEP, Oregon State, Charlotte, Kansas, Baylor, Rice, San Jose State, Tulsa, Illinois, Bowling Green, Kent State, Ball State, Georgia Southern, Texas State
This information is interesting as the bottom teams and the top teams basically rushed and passed the same ratio. The top teams did average more yards per rush, but they seem to be better in a lot of categories. We'll investigate this in the next few weeks and let you know the results.
In conclusion, we found that at least in the past, BYU's run game has been vitally important to its success. The run game should be a focus moving forward. We will follow this research up in the coming weeks, seeing if this is a general pattern in college football and determining which is more important to the run game, the running back or the offensive line.
Future Questions: Which is more important to the run game, the running back or the offensive line? Do other teams follow a similar pattern?
Please fill out the short survey below, we look at every response.
Comments
Post a Comment