MLB Payroll Effect: Do Teams Need to Pay Big to Win Big?
"The problem we're trying to solve is that there are rich teams and there are poor teams. Then there's fifty feet of crap, and then there's us. It's an unfair game."
-- "Moneyball" (movie)
The 2018 Season
In 2018, the team with the highest payroll and the team with the lowest payroll both made the MLB Playoffs. The Boston Red Sox won 108 games and the Oakland Athletics won 97 games, the Red Sox having the highest payroll and the Athletics, the lowest payroll. Boston paid nearly $2.2 million per win (payroll/wins), while the Oakland Athletics paid just over $680 thousand per win.For some teams, it may make sense to spend beaucoup bucks. Some examples may be teams like the Boston Red Sox or the New York Yankees, who have a big name, big stadium, and a big brand. Big money buys big players which sell a lot of merchandise and tickets. However, in our opinion, there is no way that this applies to every single team that had a worse regular season record than the Oakland Athletics (26 teams in total). So, we pose a question to at least some of those 26 teams...what are you buying with your money? The Athletics and the Brewers (1st and 5th cheapest payrolls), both made the playoffs, with the Brewers securing the top spot in the National League. What are these teams buying that you're not? What are they teaching? What is their strategy? What makes them different? Lastly, what are they doing so well, that you can afford to do so much better?
The Payroll Effect
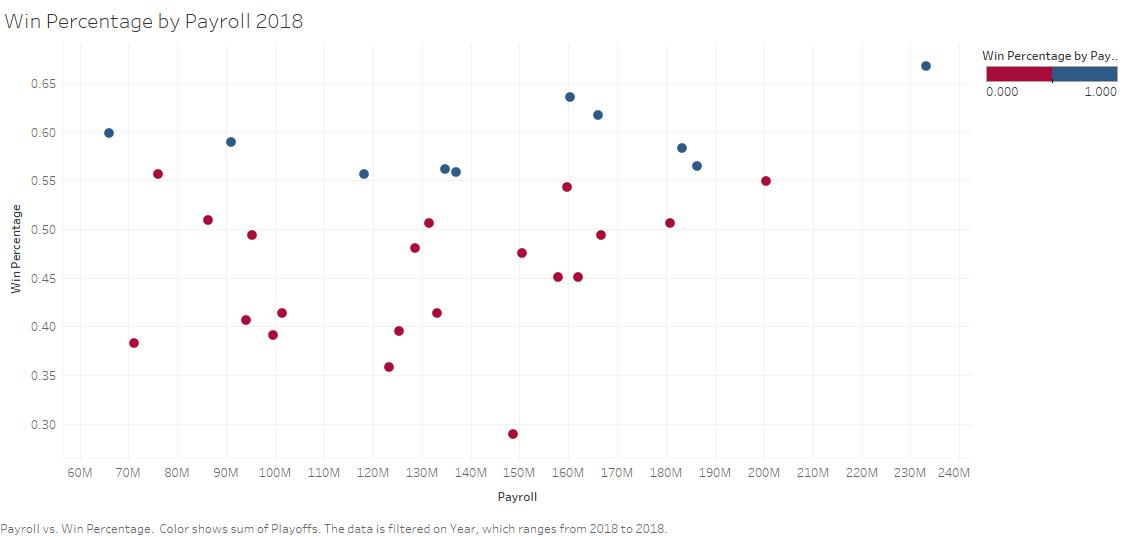
Noticing these two teams made us question, how much of a role do big payrolls play in a team's win percentage, chance at making the playoffs, and/or chance at winning the World Series? After visualizing the data, we began to think that the effect of big money may not be as large as some of us may think it is. Does big money win? A lot of the time, big money teams do win, but they are not the only ones that win big.This is a visual of the 2018 MLB teams broken down by win percentage vs payroll (win percentage on the y-axis, payroll on the x-axis), the playoff teams are in blue, the non-playoff teams are in red.
Here is a visual of the same thing (minus the playoff distinctions) for the last 19 years.
The difference doesn't seem to be large, does it? We ran some regressions, accounting for the variability amongst teams and years, and had our suspicions confirmed. Payroll has an effect on win percentage, making the playoffs, and winning the World Series. However, the effect is small on win percentage and gets smaller and smaller, telling us less and less about making the playoffs and winning the World Series. Teams don't always need to pay an arm and a leg to win games, Oakland and Milwaukee sure didn't this year.
Milwaukee has home field advantage throughout the National League Playoffs and Oakland had an impressive run this year. Big money doesn't always win big games, Oakland and Milwaukee are budget teams winning on a not so budget scale. Some call it luck, but it's awfully difficult to be lucky through a long 162 game season.
Cost per Win (Payroll/Wins) for 2018 MLB Playoff Teams
| |
Boston Red Sox
|
$2,159,263
|
Los Angeles Dodgers
|
$2,024,138
|
Chicago Cubs
|
$1,927,959
|
New York Yankees
|
$1,661,116
|
Houston Astros
|
$1,557,222
|
Colorado Rockies
|
$1,504,984
|
Cleveland Indians
|
$1,481,885
|
Atlanta Braves
|
$1,314,276
|
Milwaukee Brewers
|
$947,548
|
Oakland Athletics
|
$680,266
|
Check out similar charts and the payroll data here.
Please fill out the form below and let us know what you think!

Comments
Post a Comment